
Trump’s Tariffs: Ending Globalization

The Trump administration is reintroducing a number of 40-year-old, Reagan-era economic and military policies, but is particularly preoccupied with the imposition of tariffs for all of the country’s imports. Trump, in his inaugural address, placed significant emphasis on what the imposition of tariffs would represent, in his view: “Instead of taxing our citizens to enrich other countries we will tariff and tax foreign countries to enrich our citizens.” The same theme was echoed by his Commerce Secretary Howard Lutnick, who indicated in a CNBC television interview that “[tariffs] are going to reduce the deficit and balance the budget.” If tariffs are considered a continuous source of revenue, they cannot be expected to be negotiated down—however, given President Trump’s on-off-on and again off decisions to impose or retract tariffs, one cannot make confident predictions. Beginning with aluminum and steel imported from China, Japan, and Europe, and continuing with automobiles and other products, the administration has announced the imposition of different tariffs depending on each country’s trade-surplus position with the US, ranging from 4 percent (Turkey) to a high of 46 percent (Vietnam), with 34 percent imposed on Chinese imports, and about 25 percent on imports from South Korea and Japan. The tariffs were announced on “Liberation Day,” as the administration called it, to celebrate America’s economic independence, national sovereignty, and the revival of patriotic self-reliance. At the time of writing, however, most tariffs on US trading partners have received 90-days suspensions, replaced only by a flat 10 percent duty as some imports of electronics were also temporarily exempted. The notable exception is China, which has immediately retaliated with more reciprocal duties and restricted access to rare minerals imports.
This important celebration, however, leaves most Americans unmoved. In the words of economist Douglas Irwin, “Americans don’t want Trump’s barmy tariffs” that “are off the charts in their historic significance” (Irwin 2025). Echoing Irwin, Maurice Obstfeld (2025) argued that “Trump’s tariffs are designed for maximum damage to America.” Irwin estimates that last year’s average tariff was 2.3 percent, while the new tariffs will increase the average Americans will pay to about 30 percent—a rate in effect in the late 1800s. More specifically, the Office of the United States Trade Representative (USTR) estimates the tariffs’ effect will be to decrease the US trade deficit, especially in the product sectors it benefits the most. Retaliatory tariff calculations range from 0 to 99 percent, with unweighted and import-weighted averages of 20 and 41 percent, respectively, assuming that exchange rate and general equilibrium effects can be ignored. The USTR’s basic approach in estimating the reciprocal tariffs follows the relation below, satisfying the trade balance of zero:
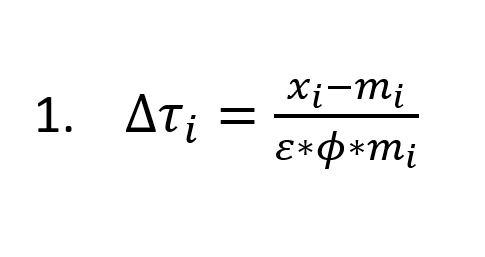
The USTR elaborates as follows. Where the US imposes, for example, a tariff of rate τ_i on country i, Δτ_i denotes the change in the tariff rate. Assuming ε < 0 represents the elasticity of imports with respect to import prices, and if φ>0 represents the passthrough from tariffs to import prices, while m_i>0 represents total imports from country i, with x_i > 0 representing total exports, then the decrease in imports due to a change in tariffs is equal to Δτ_i*ε*ϕ*m_i < 0. Based on various studies on import elasticities, it is assumed that ε is equal to 4 (USTR 2025).
According to this approach, the tariff rate consistent with balanced trade has increased in the last two administrations (Figure 1), that is, in a period where nominal tariffs have been raised substantially. Moreover, for certain categories of products and countries, this estimate returns negative figures. In line with this logic, the EU could be entitled to apply a “fair” tariff rate on mineral fuels—at a rate of 80 percent, as of 2024—to compensate for its bilateral trade deficit with the US.
Tariffs, without exception, raise inflation and cause GDP growth declines. The fears of inflation for the US in particular are germane given the current “rush and unpredictable policymaking” (Galbraith 2025). Uncertainty for the US economic outlook relates to serious concerns not only from tariffs, but also from a score of other Trump policies, including federal employee layoffs, deportations and general restrictions in immigration, deregulation, and a host of government spending cuts. These policies have been met with acute volatility, evidenced by the plummeting and sharp sell-offs in the equity markets and other movements amid President Trump’s seemingly stop-and-go tariff hikes, and other policies that have been imposed and then retracted. The investing public has turned its attention away from the US financial markets to Europeans, even though an incipient trade war will undoubtedly affect all European member states and the market economies in the rest of the world. Unlike previous US administrations, which used the reserve status of the US dollar to sanction countries, President Trump seems to have focused on tariffs as the new economic weapon, with no serious consideration of the consequences.
Figure 1: US Goods Imports and Tariff Rate as Proposed by USTR

Source: BEA
Tariffs, however, especially in times of elevated prices, could push prices even higher, abruptly creating uncertainty, affecting business decisions on hiring and investing, and negatively impacting demand and, in turn, economic growth. The uncertain economic outlook will affect the Fed’s interest rate policy and response to maintain the twin goals of maximum employment and stable prices. If history is a guide, the Fed will most likely choose the curtailing of inflation—a certain recipe for stagflation. Tariffs, therefore, will put inflation, employment, and GDP growth in jeopardy. This, of course, is not news to the Trump administration as, in early March, the president asked the American people to remain calm in a period of transition that may lead to recession. Indeed, in a recent CNBC survey of economists, headlined “tariffs stoke stagflation conditions” (Liesman 2025), GDP growth for 2025Q1 was estimated to be on the order of a mere 0.3 percent.
In a previous Strategic Analysis (Papadimitriou et al. 2024), we evaluated the potential impact of US tariff hikes by observing a synthetic indicator, namely the ratio of custom duties to the value of imports as a percent of GDP. We argued that the correlation between tariffs and the ratio of total imports to GDP has changed over time—with the period 1982–2017 being characterized by an increase in import penetration coupled with a decline in duties’ revenues. Conversely, in President Trump’s first term (2017–21), marked by a change in tariffs, revenues as a share of imports shifted back, nearly to where they stood in the 1980s, despite their marginal impact on imports. Subsequently, during the Biden administration, some tariffs were rolled back but most remained in place, and again no significant impact was observed on imports. An analysis of imports of goods and duties data for major US trading partners targeted during President Trump’s current term reveals some interesting trends.1
Specifically, there was a radical departure compared to previous decades, with an increase in tariffs on Chinese imports as shown in Figure 2. Notice that our indicator jumped from 3 percent to 11 percent, while demand for imports was sluggish, showing a modest decline of 50 basis points. The other three major US trading partners (Canada, Mexico, and the EU) did not face US tariffs as China did during Trump’s first term, with imports continuing to rise through the Biden administration.
Figure 2: US Goods Imports and Tariffs by Selected Trading Partners
Source: BEA and USITC
The composition of imports is illustrated in Table 1, indicating the main categories to have experienced an increase, especially in manufactured products, with machinery and transport equipment representing the bulk of this increase (see Table A2 in the Appendix). The rise in custom duties in manufacturing is mainly a consequence of the hike of reciprocal tariffs against China starting in 2017, while imports from this trading partner during the 2017–21 period—Trump’s first term—were mainly constituted of manufactured goods, as shown in Table 2. Moreover, road vehicles comprised more than a quarter of the machinery imported from the rest of the world in 2017 (Table A3 and Figure A3), representing only a marginal fraction of machinery imports from China. Turning to the other three major US trading partners—Mexico, Canada, and the EU—automobile imports represented the majority of machinery acquired, as China exported mainly components to the US (Table 3).
| Table 1 US Goods Imports and Tariffs | |||
| 1989-2016 | 2017-2021 | Post-2021 | |
| Import as % GDP | |||
| FOOD AND LIVE ANIMALS | 0.3 | 0.6 | 0.6 |
| BEVERAGES AND TOBACCO | 0.1 | 0.1 | 0.1 |
| CRUDE MATERIALS, INEDIBLE, EXCEPT FUELS | 0.2 | 0.2 | 0.2 |
| MINERAL FUELS, LUBRICANTS AND RELATED MATERIALS | 1.2 | 0.9 | 1.0 |
| ANIMAL AND VEGETABLE OILS, FATS AND WAXES | 0.0 | 0.0 | 0.1 |
| CHEMICALS AND RELATED PRODUCTS, N.E.S. | 0.7 | 1.3 | 1.5 |
| MANUFACTURED GOODS CLASSIFIED CHIEFLY BY MATERIAL | 1.0 | 1.3 | 1.4 |
| MACHINERY AND TRANSPORT EQUIPMENT | 3.8 | 5.1 | 5.2 |
| MISCELLANEOUS MANUFACTURED ARTICLES | 1.5 | 2.0 | 2.0 |
| COMMODITIES AND TRANSACTIONS NOT CLASSIFIED ELSEWHERE IN THE SITC | 0.4 | 0.6 | 0.6 |
| – China | 1.2 | 2.4 | 1.9 |
| – Mexico | 1.0 | 1.7 | 1.9 |
| – Canada | 1.6 | 1.5 | 1.7 |
| – EU | 1.7 | 2.4 | 2.5 |
| Custom Duties, % imports | |||
| FOOD AND LIVE ANIMALS | 1.6 | 1.2 | 1.6 |
| BEVERAGES AND TOBACCO | 1.6 | 0.8 | 0.5 |
| CRUDE MATERIALS, INEDIBLE, EXCEPT FUELS | 0.2 | 0.5 | 0.5 |
| MINERAL FUELS, LUBRICANTS AND RELATED MATERIALS | 0.2 | 0.2 | 0.1 |
| ANIMAL AND VEGETABLE OILS, FATS AND WAXES | 0.9 | 0.6 | 1.1 |
| CHEMICALS AND RELATED PRODUCTS, N.E.S. | 1.7 | 1.1 | 1.4 |
| MANUFACTURED GOODS CLASSIFIED CHIEFLY BY MATERIAL | 2.3 | 4.1 | 4.5 |
| MACHINERY AND TRANSPORT EQUIPMENT | 1.2 | 1.8 | 2.3 |
| MISCELLANEOUS MANUFACTURED ARTICLES | 6.6 | 6.2 | 6.5 |
| COMMODITIES AND TRANSACTIONS NOT CLASSIFIED ELSEWHERE IN THE SITC | 0.1 | 0.0 | 0.0 |
| – China | 4.8 | 8.1 | 12.2 |
| – Mexico | 0.8 | 0.2 | 0.2 |
| – Canada | 0.2 | 0.2 | 0.1 |
| – EU | 2.0 | 1.4 | 1.3 |
Duties for machinery (including automobiles) from Mexico, Canada, and the EU have remained substantially unchanged during the last two administrations. A notable exception was represented by mineral fuels which, after climbing to 2.4 percent in 2008, have decreased steadily due to expansion of the US shale gas industry. This ultimately reversed the trade deficit against the rest of the world. In this regard, the US now runs a trade surplus against its major partners—with the exception of Canada where its deficit has actually widened while custom duties have shrunk.
The Trump administration argues that the latest round of tariffs will help to establish a “fairer” trade by negotiating new bilateral deals and reversing some of the trends outlined above, and that, ultimately, this will engender a boost in job creation in the US and spur a new a golden age for the economy, in particular in the manufacturing sector. While there seems to be some evidence for industry-specific tariffs (machinery, in particular high-tech containing import demand as shown in Table 3) and tariffs on China being partially effective during Trump’s first term (2017–21), a closer examination of the data relating to the structure of US international trade in the last two decades shows exported goods from the US to have steadily increased their share of re-exports. These goods, according to the United States International Trade Commission (USITC) are neither grown, nor produced or manufactured in the US. They have been previously imported into the US and have not been further processed or involved in any manufacturing activity on US soil. Foreign exports of core manufactured products (manufactured goods classified chiefly by material, machinery, and transport equipment, and miscellaneous manufactured articles), represent a quarter of total goods sold abroad. This trend is common to all types of exported goods (with some exceptions, such as food and fuels; see Table A4 and Figure A4) especially for major US trading partners (Figure A5). Interestingly, the tariff hikes imposed in the Trump administration of 2017–21 seemed to have had no effect on this trend; rather, one could argue they instead had the opposite effect, especially for China (Table A5). Moreover, custom duties collected for core manufactured products as a share of imports increased from 10 percent to 15 percent during the last two administrations, but the re-export share climbed to almost 22 percent from 17.8 percent. Re-exports of machinery to Mexico accounted for 40 percent of total exported goods from the US as shown in Figure A6.
In short, President Trump’s new and stiff tariffs imposed on imports from China and other trading partners on semi-finished goods that are essential inputs for American production will backfire, directly harming US businesses. Many American companies rely on these intermediate goods to produce final products that are then sold domestically or re-exported. Making these imports more expensive from tariff hikes will increase production costs for US firms, squeezing profit margins unless they pass the additional cost to consumers, reducing demand and throwing the economy into recession. As Galbraith (2025) argues, supply and production chains are complex, and tariffs will be highly disruptive, reducing the profits of major American firms and directly affecting major supporters of the presidential campaign that led Trump to the White House.
Reciprocal tariffs from China, the EU, Canada, and other trading partners were almost immediately announced, marking the beginning of the worst trade war in history and the end of globalization. There has been no cost-benefit analysis of Trump’s tariffs, that is, if the resultant increased revenues would be beneficial to the American people. The forthcoming effects of these tariffs will hit consumers and producers with increased price levels and production costs, and reduced demand and GDP growth not only for the US but for the global economy—engendering, in the words of James K. Galbraith, “uncertainty and chaos” (Galbraith 2025).
References
Galbraith, J. K. 2025. “Trump’s Economics—and America’s Economy.” The Nation, March 19. [LINK]
Irwin, D.. 2025. “Even Americans don’t want Trump’s barmy tariffs.” By Invitation, The Economist, April 3.
Liesman, S. 2025 “First-quarter GDP growth will be just 0.3% as tariffs stoke stagflation, says CNBC survey.” CNBC, March 31. [LINK]
Obstfeld, M. 2025. “Trump’s tariffs are designed for maximum damage to America.” Realtime Economics, Peterson Institute of International Economics, April 4.
USTR (The Office of the United States Trade Representative). 2025. “Reciprocal Tariff Calculations.” U.S. Trade Representative, Executive Office of the President, Washington, D.C. [LINK]
Papadimitriou, D. B., N. Rodousakis, G. T. Yajima, and G. Zezza. 2024. “Economic Challenges of the New U.S. Administration.” Strategic Analysis. Annandale-on-Hudson, NY: Levy Economics Institute of Bard College. November.
Data Sources
Bureau of Economic Analysis (BEA), various reports.
United States International Trade Commission (USITC) dataweb, [LINK]
Appendix 1: Tables
Table A2: US Goods Imports and Tariffs by Selected Trading Partners
| China | Mexico | Canada | EU | |||||||||
| 1989-2016 | 2017-2021 | Post-2021 | 1989-2016 | 2017-2021 | Post-2021 | 1989-2016 | 2017-2021 | Post-2021 | 1989-2016 | 2017-2021 | Post-2021 | |
| Import as % GDP | ||||||||||||
| FOOD AND LIVE ANIMALS | 0.0 | 0.0 | 0.0 | 0.0 | 0.1 | 0.1 | 0.1 | 0.1 | 0.1 | 0.0 | 0.1 | 0.1 |
| BEVERAGES AND TOBACCO | 0.0 | 0.0 | 0.0 | 0.0 | 0.0 | 0.0 | 0.0 | 0.0 | 0.0 | 0.0 | 0.1 | 0.1 |
| CRUDE MATERIALS, INEDIBLE, EXCEPT FUELS | 0.0 | 0.0 | 0.0 | 0.0 | 0.0 | 0.0 | 0.1 | 0.1 | 0.1 | 0.0 | 0.0 | 0.0 |
| MINERAL FUELS, LUBRICANTS AND RELATED MATERIALS | 0.0 | 0.0 | 0.0 | 0.1 | 0.1 | 0.1 | 0.3 | 0.4 | 0.5 | 0.1 | 0.1 | 0.1 |
| ANIMAL AND VEGETABLE OILS, FATS AND WAXES | 0.0 | 0.0 | 0.0 | 0.0 | 0.0 | 0.0 | 0.0 | 0.0 | 0.0 | 0.0 | 0.0 | 0.0 |
| CHEMICALS AND RELATED PRODUCTS, N.E.S. | 0.0 | 0.1 | 0.1 | 0.0 | 0.0 | 0.0 | 0.1 | 0.1 | 0.1 | 0.3 | 0.6 | 0.7 |
| MANUFACTURED GOODS CLASSIFIED CHIEFLY BY MATERIAL | 0.1 | 0.3 | 0.2 | 0.1 | 0.1 | 0.1 | 0.2 | 0.2 | 0.2 | 0.2 | 0.2 | 0.2 |
| MACHINERY AND TRANSPORT EQUIPMENT | 0.6 | 1.2 | 1.0 | 0.6 | 1.1 | 1.2 | 0.6 | 0.4 | 0.4 | 0.7 | 0.9 | 0.9 |
| MISCELLANEOUS MANUFACTURED ARTICLES | 0.5 | 0.7 | 0.6 | 0.1 | 0.2 | 0.2 | 0.1 | 0.1 | 0.1 | 0.2 | 0.3 | 0.3 |
| COMMODITIES AND TRANSACTIONS NOT CLASSIFIED ELSEWHERE IN THE SITC | 0.0 | 0.0 | 0.0 | 0.0 | 0.1 | 0.1 | 0.1 | 0.1 | 0.1 | 0.1 | 0.2 | 0.2 |
| Custom Duties, % imports | ||||||||||||
| FOOD AND LIVE ANIMALS | 2.0 | 14.8 | 24.9 | 4.0 | 0.1 | 0.3 | 0.3 | 0.1 | 0.1 | 3.7 | 4.4 | 4.6 |
| BEVERAGES AND TOBACCO | 5.8 | 11.1 | 14.0 | 0.9 | 0.0 | 0.1 | 0.7 | 0.6 | 0.3 | 1.2 | 1.2 | 0.7 |
| CRUDE MATERIALS, INEDIBLE, EXCEPT FUELS | 1.0 | 8.7 | 11.9 | 0.1 | 0.0 | 0.1 | 0.0 | 0.0 | 0.0 | 1.0 | 0.4 | 0.4 |
| MINERAL FUELS, LUBRICANTS AND RELATED MATERIALS | 0.3 | 6.6 | 16.0 | 0.2 | 0.0 | 0.0 | 0.0 | 0.1 | 0.1 | 0.7 | 0.5 | 0.4 |
| ANIMAL AND VEGETABLE OILS, FATS AND WAXES | 1.6 | 6.9 | 8.2 | 0.9 | 0.1 | 0.2 | 0.6 | 0.1 | 0.7 | 2.0 | 1.8 | 1.7 |
| CHEMICALS AND RELATED PRODUCTS, N.E.S. | 3.4 | 9.5 | 12.2 | 0.4 | 0.3 | 0.3 | 0.4 | 0.1 | 0.1 | 2.0 | 0.6 | 0.6 |
| MANUFACTURED GOODS CLASSIFIED CHIEFLY BY MATERIAL | 5.1 | 13.3 | 21.8 | 0.9 | 0.7 | 0.2 | 0.3 | 0.8 | 0.1 | 3.1 | 3.5 | 2.6 |
| MACHINERY AND TRANSPORT EQUIPMENT | 1.9 | 5.6 | 9.9 | 0.7 | 0.2 | 0.3 | 0.1 | 0.1 | 0.2 | 1.7 | 1.3 | 1.3 |
| MISCELLANEOUS MANUFACTURED ARTICLES | 7.6 | 10.8 | 13.7 | 1.4 | 0.2 | 0.2 | 0.6 | 0.1 | 0.1 | 3.8 | 2.3 | 2.5 |
| COMMODITIES AND TRANSACTIONS NOT CLASSIFIED ELSEWHERE IN THE SITC | 0.1 | 0.1 | 0.1 | 0.0 | 0.0 | 0.0 | 0.0 | 0.0 | 0.0 | 0.1 | 0.0 | 0.0 |
Source: BEA and USITC
Table A3: US Machinery Imports and Tariffs, by Selected Trading Partners
| All TP | China | Mexico | Canada | EU | ||||||||||||
| 1989-2016 | 2017-2021 | Post-2021 | 1989-2016 | 2017-2021 | Post-2021 | 1989-2016 | 2017-2021 | Post-2021 | 1989-2016 | 2017-2021 | Post-2021 | 1989-2016 | 2017-2021 | Post-2021 | ||
| Import as % GDP | ||||||||||||||||
| POWER GENERATING MACHINERY AND EQUIPMENT | 0.2 | 0.3 | 0.3 | 0.0 | 0.0 | 0.0 | 0.0 | 0.1 | 0.1 | 0.0 | 0.0 | 0.0 | 0.1 | 0.1 | 0.1 | |
| MACHINERY SPECIALIZED FOR PARTICULAR INDUSTRIES | 0.2 | 0.3 | 0.3 | 0.0 | 0.0 | 0.0 | 0.0 | 0.0 | 0.0 | 0.0 | 0.0 | 0.0 | 0.1 | 0.1 | 0.1 | |
| METALWORKING MACHINERY | 0.0 | 0.1 | 0.1 | 0.0 | 0.0 | 0.0 | 0.0 | 0.0 | 0.0 | 0.0 | 0.0 | 0.0 | 0.0 | 0.0 | 0.0 | |
| GENERAL INDUSTRIAL MACHINERY AND EQUIPMENT, N.E.S., AND MACHINE PARTS, N.E.S. | 0.3 | 0.5 | 0.6 | 0.0 | 0.1 | 0.1 | 0.0 | 0.1 | 0.1 | 0.0 | 0.0 | 0.0 | 0.1 | 0.1 | 0.2 | |
| OFFICE MACHINES AND AUTOMATIC DATA PROCESSING MACHINES | 0.6 | 0.7 | 0.7 | 0.2 | 0.3 | 0.2 | 0.1 | 0.1 | 0.2 | 0.0 | 0.0 | 0.0 | 0.0 | 0.0 | 0.0 | |
| TELECOMMUNICATIONS AND SOUND RECORDING AND REPRODUCING APPARATUS AND EQUIPMENT | 0.5 | 0.8 | 0.7 | 0.2 | 0.4 | 0.3 | 0.1 | 0.1 | 0.1 | 0.0 | 0.0 | 0.0 | 0.0 | 0.0 | 0.0 | |
| ELECTRICAL MACHINERY, APPARATUS AND APPLIANCES* | 0.7 | 0.9 | 1.1 | 0.1 | 0.2 | 0.2 | 0.1 | 0.2 | 0.2 | 0.0 | 0.0 | 0.0 | 0.1 | 0.1 | 0.1 | |
| – ROAD VEHICLES (INCLUDING AIR-CUSHION VEHICLES) | 1.1 | 1.4 | 1.4 | 0.0 | 0.1 | 0.1 | 0.2 | 0.4 | 0.5 | 0.3 | 0.2 | 0.2 | 0.2 | 0.3 | 0.3 | |
| TRANSPORT EQUIPMENT, N.E.S. | 0.1 | 0.2 | 0.1 | 0.0 | 0.0 | 0.0 | 0.0 | 0.0 | 0.0 | 0.0 | 0.0 | 0.0 | 0.1 | 0.1 | 0.1 | |
| Custom Duties, % imports | ||||||||||||||||
| POWER GENERATING MACHINERY AND EQUIPMENT | 1.0 | 1.8 | 2.4 | 3.2 | 17.2 | 31.1 | 0.7 | 0.3 | 0.6 | 0.2 | 0.1 | 0.2 | 1.0 | 0.8 | 0.8 | |
| MACHINERY SPECIALIZED FOR PARTICULAR INDUSTRIES | 1.1 | 1.7 | 2.2 | 1.4 | 13.6 | 23.5 | 0.3 | 0.1 | 0.1 | 0.2 | 0.1 | 0.1 | 1.2 | 0.7 | 0.6 | |
| METALWORKING MACHINERY | 3.2 | 3.8 | 3.8 | 3.6 | 21.8 | 32.5 | 0.6 | 0.7 | 1.0 | 0.4 | 0.1 | 0.2 | 3.5 | 3.1 | 3.0 | |
| GENERAL INDUSTRIAL MACHINERY AND EQUIPMENT, N.E.S., AND MACHINE PARTS, N.E.S. | 1.6 | 3.0 | 4.2 | 2.7 | 12.9 | 23.4 | 0.5 | 0.2 | 0.3 | 0.3 | 0.2 | 0.2 | 1.9 | 1.0 | 1.0 | |
| OFFICE MACHINES AND AUTOMATIC DATA PROCESSING MACHINES | 0.4 | 0.6 | 0.7 | 0.7 | 1.5 | 2.0 | 0.3 | 0.0 | 0.0 | 0.1 | 0.0 | 0.0 | 0.5 | 0.0 | 0.0 | |
| TELECOMMUNICATIONS AND SOUND RECORDING AND REPRODUCING APPARATUS AND EQUIPMENT | 1.5 | 0.9 | 1.1 | 2.0 | 1.7 | 2.3 | 1.0 | 0.0 | 0.0 | 0.5 | 0.0 | 0.0 | 1.9 | 0.2 | 0.0 | |
| ELECTRICAL MACHINERY, APPARATUS AND APPLIANCES* | 1.1 | 2.9 | 3.6 | 2.4 | 10.8 | 16.7 | 0.9 | 0.3 | 0.3 | 0.3 | 0.3 | 0.3 | 1.7 | 1.1 | 1.1 | |
| ROAD VEHICLES (INCLUDING AIR-CUSHION VEHICLES) | 1.5 | 1.7 | 2.2 | 5.2 | 16.5 | 28.9 | 0.6 | 0.1 | 0.3 | 0.1 | 0.1 | 0.2 | 2.5 | 2.6 | 2.5 | |
| TRANSPORT EQUIPMENT, N.E.S. | 0.2 | 0.4 | 0.6 | 0.8 | 19.1 | 29.1 | 0.1 | 0.0 | 0.1 | 0.1 | 0.0 | 0.0 | 0.2 | 0.2 | 0.2 | |
Source: BEA and USITC
* N.E.S., AND ELECTRICAL PARTS THEREOF (INCLUDING NONELECTRICAL COUNTERPARTS OF HOUSEHOLD TYPE, N.E.S.)
Table A4 Goods Exports and Their Foreign Content Share
| 1989-2016 | 2017-2021 | Post-2021 | |
| Total Exports (% of GDP) | |||
| FOOD AND LIVE ANIMALS | 0.4 | 0.5 | 0.5 |
| BEVERAGES AND TOBACCO | 0.0 | 0.0 | 0.0 |
| CRUDE MATERIALS, INEDIBLE, EXCEPT FUELS | 0.3 | 0.4 | 0.4 |
| MINERAL FUELS, LUBRICANTS AND RELATED MATERIALS | 0.3 | 0.9 | 1.2 |
| ANIMAL AND VEGETABLE OILS, FATS AND WAXES | 0.0 | 0.0 | 0.0 |
| CHEMICALS AND RELATED PRODUCTS, N.E.S. | 0.8 | 1.1 | 1.1 |
| MANUFACTURED GOODS CLASSIFIED CHIEFLY BY MATERIAL | 0.6 | 0.6 | 0.6 |
| MACHINERY AND TRANSPORT EQUIPMENT | 2.9 | 3.0 | 2.6 |
| MISCELLANEOUS MANUFACTURED ARTICLES | 0.7 | 0.8 | 0.7 |
| COMMODITIES AND TRANSACTIONS NOT CLASSIFIED ELSEWHERE IN THE SITC | 0.3 | 0.3 | 0.4 |
| – China | 0.3 | 0.6 | 0.6 |
| – Mexico | 0.8 | 1.2 | 1.2 |
| – Canada | 1.3 | 1.4 | 1.3 |
| – EU | 1.3 | 1.5 | 1.5 |
| Foreign content of exports (Percent) | |||
| FOOD AND LIVE ANIMALS | 3.3 | 3.7 | 3.9 |
| BEVERAGES AND TOBACCO | 4.6 | 17.0 | 9.7 |
| CRUDE MATERIALS, INEDIBLE, EXCEPT FUELS | 1.6 | 1.5 | 1.6 |
| MINERAL FUELS, LUBRICANTS AND RELATED MATERIALS | 1.2 | 1.1 | 1.9 |
| ANIMAL AND VEGETABLE OILS, FATS AND WAXES | 2.6 | 9.0 | 14.8 |
| CHEMICALS AND RELATED PRODUCTS, N.E.S. | 2.9 | 6.7 | 9.8 |
| MANUFACTURED GOODS CLASSIFIED CHIEFLY BY MATERIAL | 11.9 | 23.8 | 24.1 |
| MACHINERY AND TRANSPORT EQUIPMENT | 12.7 | 23.4 | 25.3 |
| MISCELLANEOUS MANUFACTURED ARTICLES | 13.2 | 26.1 | 28.9 |
| COMMODITIES AND TRANSACTIONS NOT CLASSIFIED ELSEWHERE IN THE SITC | 3.9 | 4.3 | 9.5 |
| – China | 4.6 | 10.4 | 13.3 |
| – Mexico | 11.4 | 23.3 | 22.5 |
| – Canada | 12.3 | 17.6 | 17.6 |
| – EU | 8.2 | 13.6 | 13.9 |
Source: BEA and USITC
Table A5 Goods Exports and Their Foreign Content Share by Selected Trading Partner
| China | Mexico | Canada | EU | |||||||||
| 1989-2016 | 2017-2021 | Post-2021 | 1989-2016 | 2017-2021 | Post-2021 | 1989-2016 | 2017-2021 | Post-2021 | 1989-2016 | 2017-2021 | Post-2021 | |
| Total Exports (% of GDP) | ||||||||||||
| FOOD AND LIVE ANIMALS | 0.0 | 0.0 | 0.1 | 0.0 | 0.1 | 0.1 | 0.1 | 0.1 | 0.1 | 0.0 | 0.0 | 0.0 |
| BEVERAGES AND TOBACCO | 0.0 | 0.0 | 0.0 | 0.0 | 0.0 | 0.0 | 0.0 | 0.0 | 0.0 | 0.0 | 0.0 | 0.0 |
| CRUDE MATERIALS, INEDIBLE, EXCEPT FUELS | 0.1 | 0.1 | 0.1 | 0.0 | 0.0 | 0.0 | 0.0 | 0.0 | 0.0 | 0.1 | 0.1 | 0.1 |
| MINERAL FUELS, LUBRICANTS AND RELATED MATERIALS | 0.0 | 0.0 | 0.1 | 0.0 | 0.2 | 0.2 | 0.1 | 0.1 | 0.1 | 0.0 | 0.1 | 0.3 |
| ANIMAL AND VEGETABLE OILS, FATS AND WAXES | 0.0 | 0.0 | 0.0 | 0.0 | 0.0 | 0.0 | 0.0 | 0.0 | 0.0 | 0.0 | 0.0 | 0.0 |
| CHEMICALS AND RELATED PRODUCTS, N.E.S. | 0.0 | 0.1 | 0.1 | 0.1 | 0.1 | 0.1 | 0.1 | 0.2 | 0.2 | 0.2 | 0.3 | 0.3 |
| MANUFACTURED GOODS CLASSIFIED CHIEFLY BY MATERIAL | 0.0 | 0.0 | 0.0 | 0.1 | 0.1 | 0.1 | 0.2 | 0.2 | 0.2 | 0.1 | 0.1 | 0.1 |
| MACHINERY AND TRANSPORT EQUIPMENT | 0.1 | 0.2 | 0.2 | 0.4 | 0.5 | 0.5 | 0.6 | 0.6 | 0.5 | 0.6 | 0.6 | 0.5 |
| MISCELLANEOUS MANUFACTURED ARTICLES | 0.0 | 0.1 | 0.0 | 0.1 | 0.1 | 0.1 | 0.1 | 0.1 | 0.1 | 0.2 | 0.2 | 0.2 |
| COMMODITIES AND TRANSACTIONS NOT CLASSIFIED ELSEWHERE IN THE SITC | 0.0 | 0.0 | 0.0 | 0.0 | 0.0 | 0.0 | 0.1 | 0.1 | 0.1 | 0.1 | 0.1 | 0.1 |
| Foreign content of exports (Percent) | ||||||||||||
| FOOD AND LIVE ANIMALS | 1.0 | 0.9 | 0.4 | 1.4 | 1.5 | 1.5 | 13.0 | 14.1 | 15.1 | 1.8 | 2.4 | 2.6 |
| BEVERAGES AND TOBACCO | 2.4 | 3.5 | 1.5 | 27.0 | 7.1 | 9.4 | 8.2 | 28.8 | 10.6 | 2.3 | 9.5 | 6.9 |
| CRUDE MATERIALS, INEDIBLE, EXCEPT FUELS | 0.8 | 0.2 | 0.3 | 2.8 | 4.6 | 4.5 | 4.8 | 6.5 | 7.5 | 1.1 | 1.0 | 0.8 |
| MINERAL FUELS, LUBRICANTS AND RELATED MATERIALS | 1.7 | 5.0 | 11.8 | 0.7 | 0.7 | 0.5 | 3.0 | 1.7 | 1.7 | 0.6 | 0.4 | 0.7 |
| ANIMAL AND VEGETABLE OILS, FATS AND WAXES | 0.3 | 5.4 | 6.5 | 1.7 | 5.9 | 7.1 | 11.9 | 42.9 | 42.4 | 1.5 | 2.3 | 2.4 |
| CHEMICALS AND RELATED PRODUCTS, N.E.S. | 1.4 | 10.2 | 19.0 | 2.8 | 6.2 | 7.1 | 5.5 | 10.6 | 11.4 | 2.6 | 6.3 | 10.1 |
| MANUFACTURED GOODS CLASSIFIED CHIEFLY BY MATERIAL | 3.3 | 21.5 | 26.5 | 5.6 | 15.4 | 16.0 | 7.3 | 13.8 | 15.3 | 16.0 | 25.2 | 29.7 |
| MACHINERY AND TRANSPORT EQUIPMENT | 7.9 | 14.2 | 17.3 | 19.5 | 41.0 | 40.1 | 15.0 | 22.2 | 22.9 | 10.5 | 19.0 | 21.7 |
| MISCELLANEOUS MANUFACTURED ARTICLES | 8.4 | 17.7 | 21.8 | 12.8 | 35.7 | 43.3 | 17.0 | 31.2 | 32.5 | 12.9 | 25.1 | 26.0 |
| COMMODITIES AND TRANSACTIONS NOT CLASSIFIED ELSEWHERE IN THE SITC | 0.2 | 0.2 | 0.2 | 0.7 | 0.5 | 0.4 | 17.1 | 5.5 | 4.7 | 1.0 | 3.7 | 4.4 |
Appendix 2: Figures
Figure A3: US Road Vehicles Imports and Tariffs by Selected Trading Partners

Source: BEA and USITC
Figure A4: US Goods Exports and Their Foreign Content Share by Selected Commodities

Source: BEA and USITC
Figure A5: US Goods Exports and Their Foreign Content Share by Selected Trading Partners

Source: BEA and USITC
Figure A6: US Machinery Exports and their Foreign Content Share by Selected Trading Partners

Source: BEA and USITC